HTML Canvas Essentials
Reviewed & published by Brayan K
The HTML <canvas> element is a blank, bitmap drawing surface that you control entirely from JavaScript through its 2D context, letting you draw shapes, text, images, and gradients pixel by pixel for games, charts, and animations.
Part of the free HTML & CSS course at LearnCodingFast — hands-on lessons with examples you run in your browser, plus practice exercises and a quick quiz.
By the end you'll draw shapes, text, and gradients on a <canvas>, capture mouse input to draw freehand, and run a smooth animation loop with requestAnimationFrame.
What You'll Learn
- Get a 2D drawing context with getContext('2d') and draw on the bitmap
- Draw rectangles, circles, triangles, and custom paths with arc, moveTo, and lineTo
- Tell fill from stroke and apply colours, line widths, and linear gradients
- Render text, draw images, and clear the canvas with clearRect
- Capture mouse events to build an interactive freehand drawing pad
- Animate at ~60fps with requestAnimationFrame and bounce objects off walls
Before you start: Canvas is driven entirely by JavaScript, so you'll want to be comfortable with variables, functions, and events first. If you need a refresher, revisit the JavaScript course.
💡 Real-World Analogy
Think of canvas as a whiteboard with a single marker. You don't place objects you can move later — you give the browser instructions ("put the pen here, draw a circle, fill it green"), and it stains the board with pixels. Once a stroke is down it isn't a separate "thing" anymore; to change it you wipe the area and redraw. That's why animation means clear, then redraw the whole scene on every frame.
1. The drawing context
The <canvas> element is just a blank rectangle until you grab its 2D context — the object that holds every drawing method. You get it once and reuse it:
Coordinates start at (0, 0) in the top-left; x grows to the right and y grows downward. Canvas is great for games, charts, and effects; for icons and logos prefer SVG (next lesson) because it stays sharp at any zoom.
Canvas vs SVG — pick the right tool
| Feature | Canvas | SVG |
|---|---|---|
| Type | Pixel-based (bitmap) | Vector-based (DOM nodes) |
| Scaling | Gets blurry on zoom | Infinitely sharp |
| Best for | Games, visualisations, effects | Icons, logos, diagrams |
| Interactivity | Manual hit-testing | Native DOM events per element |
| Performance | Better with many objects | Slows with 100s of nodes |
2. Shapes, fills, strokes, text & gradients
Read this fully-commented example, then run it. Notice three patterns you'll use constantly: fill vs stroke (inside colour vs outline), paths (beginPath → arc/lineTo → fill/stroke), and a gradient built from colour stops.
<!DOCTYPE html>
<html>
<head>
<style>
  body { font-family: system-ui, sans-serif; padding: 24px; }
  /* Set the drawing size with width/height ATTRIBUTES below, not CSS */
  canvas { border: 2px solid #ddd; border-radius: 8px; background: #fafafa; display: block; }
</style>
</head>
<body>
  <h1>Shapes, Fills & Strokes</h1>
  <!-- width/height here set the real pixel resolution of the bitmap -->
  <canvas id="art" width="500" height="300">
    Your browser does not support canvas.  <!-- fallback text for screen readers -->
  </canvas>

  <script>
    // 1) Grab the canvas and ask it for a 2D drawing context.
    const canvas = document.getElementById('art');
    const ctx = canvas.getContext('2d');     // ctx = the "pen" you draw with

    // 2) A FILLED rectangle: fillStyle sets the colour, fillRect(x, y, w, h) paints it.
    ctx.fillStyle = '#1976D2';               // colour applies to every fill after this
    ctx.fillRect(20, 20, 120, 80);           // top-left at (20,20), 120 wide, 80 tall

    // 3) A STROKED (outline-only) rectangle. stroke = the border, fill = the inside.
    ctx.strokeStyle = '#E91E63';             // outline colour
    ctx.lineWidth = 4;                       // outline thickness in pixels
    ctx.strokeRect(170, 20, 120, 80);        // outline only — no fill

    // 4) A circle uses a PATH: begin it, arc it, then fill/stroke it.
    ctx.beginPath();                         // start a fresh path (always do this first!)
    ctx.arc(380, 60, 45, 0, Math.PI * 2);    // centre (380,60), radius 45, full circle
    ctx.fillStyle = '#4CAF50';
    ctx.fill();                              // paint the inside green

    // 5) A triangle from three line segments. closePath() draws back to the start.
    ctx.beginPath();
    ctx.moveTo(60, 200);                     // move the pen WITHOUT drawing
    ctx.lineTo(140, 200);                    // draw a line to here
    ctx.lineTo(100, 130);                    // and to here
    ctx.closePath();                         // joins the last point back to (60,200)
    ctx.fillStyle = '#FF9800';
    ctx.fill();

    // 6) Text: set the font, then fillText(text, x, y) — y is the text BASELINE.
    ctx.font = 'bold 18px system-ui';
    ctx.fillStyle = '#333';
    ctx.fillText('Canvas is powerful!', 180, 170);

    // 7) A gradient: define colour stops, then use it as a fillStyle.
    const grad = ctx.createLinearGradient(20, 240, 480, 240);  // left -> right
    grad.addColorStop(0, '#F44336');         // 0 = start
    grad.addColorStop(0.5, '#FF9800');       // 0.5 = middle
    grad.addColorStop(1, '#4CAF50');         // 1 = end
    ctx.fillStyle = grad;
    ctx.fillRect(20, 240, 460, 40);          // a smooth red->orange->green bar

    // ✅ Expected: blue filled box, pink outlined box, green circle, orange
    //    triangle, dark text, and a rainbow gradient bar along the bottom.
  </script>
</body>
</html>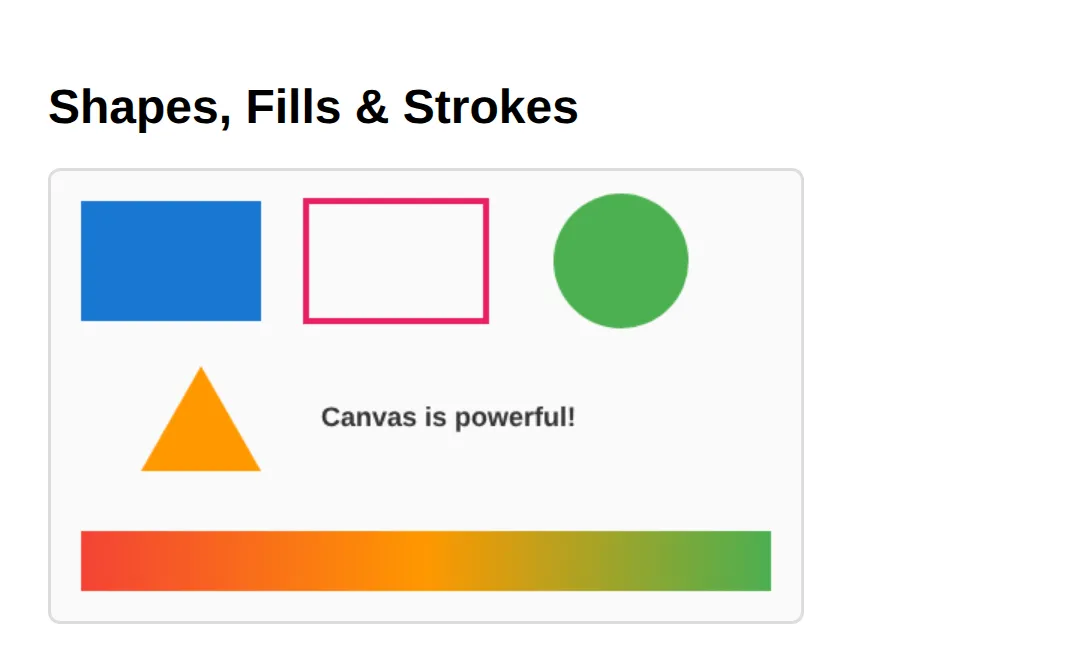
Important: Set canvas size with HTML attributes (<canvas width="500" height="300">), not CSS. CSS only stretches the bitmap — the real resolution stays at the attribute values, so mismatched CSS sizes produce blurry output.
3. 🎯 Your turn — a traffic light
Time to practise fill and beginPath. Fill in the blanks marked ___ following the 👉 hints. Each lamp is its own path, so beginPath() before every circle.
<!DOCTYPE html>
<html>
<head><style>
  body { font-family: system-ui, sans-serif; padding: 24px; }
  canvas { border: 2px solid #ddd; border-radius: 8px; background: #fff; display: block; }
</style></head>
<body>
  <h1>🎯 YOUR TURN — Draw a Traffic Light</h1>
  <canvas id="light" width="160" height="320">Canvas not supported.</canvas>
  <script>
    const ctx = document.getElementById('light').getContext('2d');

    // The black backing box is done for you:
    ctx.fillStyle = '#222';
    ctx.fillRect(40, 20, 80, 280);

    // 1) RED lamp — fill a circle at centre (80, 80), radius 28.
    ctx.beginPath();
    ctx.arc(80, 80, 28, 0, Math.PI * 2);
    ctx.fillStyle = ___;        // 👉 set this to 'red'
    ctx.fill();                 // 👉 and call fill() to paint it (uncomment if needed)

    // 2) AMBER lamp — its own NEW path at (80, 160), radius 28.
    ctx.beginPath();            // 👉 always beginPath() before a new shape
    ctx.arc(80, 160, 28, 0, Math.PI * 2);
    ctx.fillStyle = 'orange';
    ___;                        // 👉 call ctx.fill() here

    // 3) GREEN lamp — finish this one entirely (path, arc, colour, fill).
    // 👉 beginPath, arc at (80, 240) radius 28, fillStyle 'limegreen', fill

    // ✅ Expected: three glowing lamps (red, amber, green) on a black box.
  </script>
</body>
</html>
4. Capturing mouse input
To draw freehand you turn mouse positions into a path. On mousedown you start a path, on mousemove you lineTo the new point and stroke(), and you stop on mouseup. getBoundingClientRect() converts the page coordinates into canvas-local ones.
<!DOCTYPE html>
<html>
<head>
<style>
  body { font-family: system-ui, sans-serif; padding: 24px; }
  canvas { border: 2px solid #ddd; border-radius: 8px; background: #fff; cursor: crosshair; display: block; margin-top: 12px; }
  .controls { display: flex; gap: 8px; flex-wrap: wrap; align-items: center; }
  .controls button { padding: 8px 16px; border: 2px solid #1976D2; background: transparent; color: #1976D2; border-radius: 6px; cursor: pointer; font-weight: 600; }
  .controls button:hover { background: #E3F2FD; }
  .controls input[type="color"] { width: 40px; height: 32px; border: none; cursor: pointer; }
</style>
</head>
<body>
  <h1>Drawing Pad — Hold & Drag to Draw</h1>
  <div class="controls">
    <input type="color" id="color" value="#1976D2">    <!-- pen colour -->
    <button id="clear">Clear</button>
  </div>
  <canvas id="pad" width="500" height="300">Canvas not supported.</canvas>

  <script>
    const pad = document.getElementById('pad');
    const ctx = pad.getContext('2d');
    ctx.lineWidth = 3;
    ctx.lineCap = 'round';          // rounded line ends look like a real pen
    ctx.lineJoin = 'round';
    let drawing = false;

    // Convert a mouse event into canvas-local x/y coordinates.
    function pos(e) {
      const r = pad.getBoundingClientRect();
      return { x: e.clientX - r.left, y: e.clientY - r.top };
    }

    // mousedown: start a fresh path at the click point.
    pad.addEventListener('mousedown', (e) => {
      drawing = true;
      const p = pos(e);
      ctx.beginPath();
      ctx.moveTo(p.x, p.y);
    });

    // mousemove: while the button is held, extend the line and stroke it.
    pad.addEventListener('mousemove', (e) => {
      if (!drawing) return;
      const p = pos(e);
      ctx.lineTo(p.x, p.y);
      ctx.stroke();                 // draws the segment we just added
    });

    // stop drawing on mouseup or when the pointer leaves the canvas.
    pad.addEventListener('mouseup', () => { drawing = false; });
    pad.addEventListener('mouseleave', () => { drawing = false; });

    // colour picker updates the pen colour live.
    document.getElementById('color').addEventListener('input', (e) => {
      ctx.strokeStyle = e.target.value;
    });

    // Clear wipes the whole bitmap back to transparent.
    document.getElementById('clear').addEventListener('click', () => {
      ctx.clearRect(0, 0, 500, 300);
    });

    // ✅ Expected: hold the mouse and drag to draw; change colour; Clear erases.
  </script>
  <!-- ✅ Expected result, measured in a real browser:
     canvas -> display: block
     .controls -> display: flex
     .controls button -> cursor: pointer
     .controls input[type="color"] -> cursor: pointer
  -->
</body>
</html>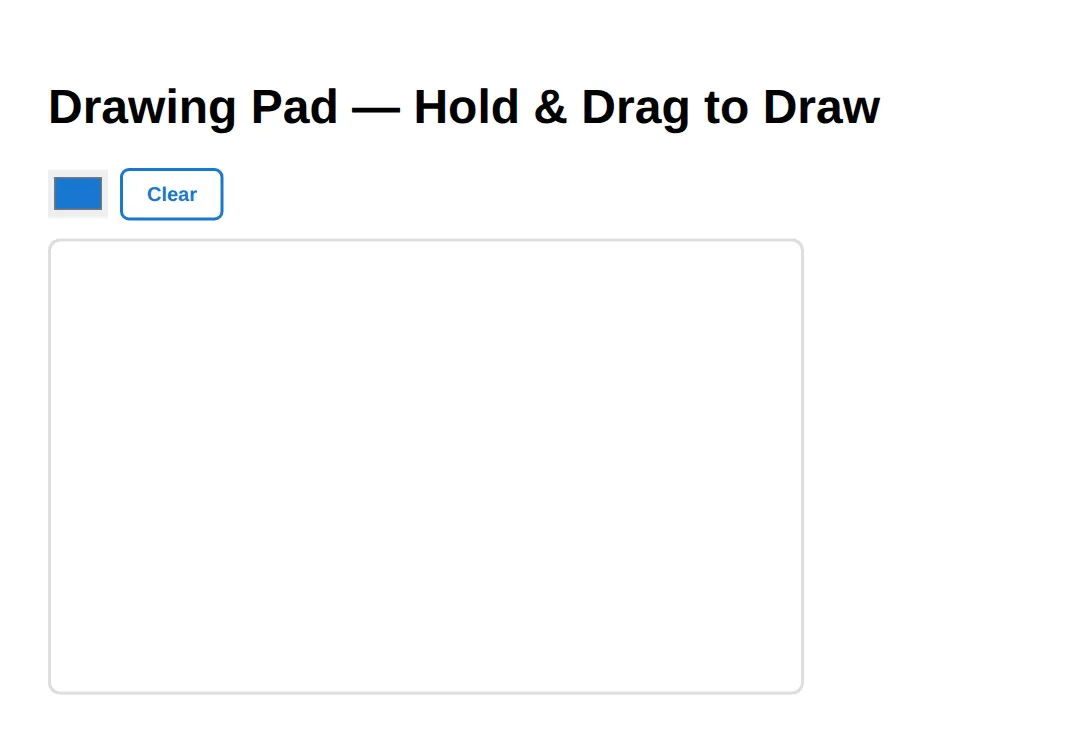
5. Animating with requestAnimationFrame
An animation is just a function that draws one frame and then asks to be called again. requestAnimationFrame(fn) runs fn right before the next repaint (~60 times/sec). Each frame you clear (or paint a faint layer for trails), update positions, redraw, then schedule the next frame.
<!DOCTYPE html>
<html>
<head>
<style>
  body { font-family: system-ui, sans-serif; padding: 24px; }
  canvas { border: 2px solid #ddd; border-radius: 8px; background: #1a1a2e; display: block; }
</style>
</head>
<body>
  <h1>Bouncing Balls — requestAnimationFrame</h1>
  <canvas id="anim" width="500" height="300">Canvas not supported.</canvas>

  <script>
    const ctx = document.getElementById('anim').getContext('2d');

    // Build a few balls, each with a position, velocity (dx/dy), radius, colour.
    const balls = Array.from({ length: 8 }, () => ({
      x: Math.random() * 460 + 20,
      y: Math.random() * 260 + 20,
      dx: (Math.random() - 0.5) * 4,         // horizontal speed (can be negative)
      dy: (Math.random() - 0.5) * 4,         // vertical speed
      r: Math.random() * 15 + 8,
      color: 'hsl(' + Math.random() * 360 + ', 70%, 60%)'
    }));

    function animate() {
      // Semi-transparent fill instead of clearRect = motion trails.
      ctx.fillStyle = 'rgba(26, 26, 46, 0.2)';
      ctx.fillRect(0, 0, 500, 300);

      balls.forEach(b => {
        b.x += b.dx;                          // move
        b.y += b.dy;
        // Bounce off the walls by flipping the velocity.
        if (b.x - b.r < 0 || b.x + b.r > 500) b.dx *= -1;
        if (b.y - b.r < 0 || b.y + b.r > 300) b.dy *= -1;

        ctx.beginPath();                      // new path per ball
        ctx.arc(b.x, b.y, b.r, 0, Math.PI * 2);
        ctx.fillStyle = b.color;
        ctx.fill();
      });

      requestAnimationFrame(animate);         // ~60 frames per second
    }
    requestAnimationFrame(animate);

    // ✅ Expected: 8 coloured balls bounce around leaving soft trails.
    //    (To draw a photo instead, load an Image then ctx.drawImage(img, x, y).)
  </script>
  <!-- ✅ Expected result, measured in a real browser:
     body -> padding-top: 24px
     canvas -> display: block
  -->
</body>
</html>
6. 🎯 Your turn — a moving square
Build your own animation loop. Fill in the three blanks: the clear method, and the function name passed to requestAnimationFrame so the loop keeps going.
<!DOCTYPE html>
<html>
<head><style>
  body { font-family: system-ui, sans-serif; padding: 24px; }
  canvas { border: 2px solid #ddd; border-radius: 8px; background: #1a1a2e; display: block; }
</style></head>
<body>
  <h1>🎯 YOUR TURN — Slide a Square Across</h1>
  <canvas id="stage" width="500" height="160">Canvas not supported.</canvas>
  <script>
    const ctx = document.getElementById('stage').getContext('2d');
    let x = 0;                  // the square's left edge

    function frame() {
      // 1) CLEAR the whole canvas so the old square doesn't smear.
      ctx.___(0, 0, 500, 160);  // 👉 method is clearRect (clears a rectangle)

      // 2) Draw the square at its current x.
      ctx.fillStyle = '#64B5F6';
      ctx.fillRect(x, 60, 40, 40);

      // 3) Move it 2px right; wrap back to the left when it leaves the screen.
      x += 2;
      if (x > 500) x = -40;

      // 4) Ask the browser to run this function again before the next repaint.
      requestAnimationFrame(___);   // 👉 pass the function name: frame

      // ✅ Expected: a blue square glides smoothly left → right, forever.
    }
    requestAnimationFrame(frame);   // kick off the loop
  </script>
</body>
</html>
7. A real example — bar chart from data
Loops + rectangles + text alignment combine into a genuine data visualisation. Watch how textAlign = 'center' changes what the x coordinate means for the labels.
<!DOCTYPE html>
<html>
<head>
<style>
  body { font-family: system-ui, sans-serif; padding: 24px; }
  canvas { border: 2px solid #ddd; border-radius: 8px; background: #fff; display: block; }
</style>
</head>
<body>
  <h1>Bar Chart from Data</h1>
  <canvas id="chart" width="500" height="300">Canvas not supported.</canvas>

  <script>
    const ctx = document.getElementById('chart').getContext('2d');
    const data = [
      { label: 'Jan', value: 65 }, { label: 'Feb', value: 45 },
      { label: 'Mar', value: 80 }, { label: 'Apr', value: 55 },
      { label: 'May', value: 92 }, { label: 'Jun', value: 70 }
    ];
    const maxVal = Math.max(...data.map(d => d.value));   // tallest bar = 92
    const colors = ['#1976D2', '#4CAF50', '#FF9800', '#E91E63', '#9C27B0', '#00BCD4'];
    const barW = 50, gap = 20, startX = 60, baseline = 260;

    // Chart title.
    ctx.fillStyle = '#1565C0';
    ctx.font = 'bold 16px system-ui';
    ctx.textAlign = 'left';
    ctx.fillText('Monthly Sales', startX, 25);

    data.forEach((d, i) => {
      const x = startX + i * (barW + gap);
      const h = (d.value / maxVal) * (baseline - 50);     // scale to fit
      // The bar itself.
      ctx.fillStyle = colors[i];
      ctx.fillRect(x, baseline - h, barW, h);
      // The month label, centred under the bar.
      ctx.fillStyle = '#333';
      ctx.font = 'bold 12px system-ui';
      ctx.textAlign = 'center';                            // x is now the bar's centre
      ctx.fillText(d.label, x + barW / 2, baseline + 18);
      // The value above the bar.
      ctx.fillStyle = colors[i];
      ctx.fillText(d.value, x + barW / 2, baseline - h - 8);
    });

    // ✅ Expected: six coloured bars of different heights with labels and values.
  </script>
  <!-- ✅ Expected result, measured in a real browser:
     body -> padding-top: 24px
     canvas -> display: block
  -->
</body>
</html>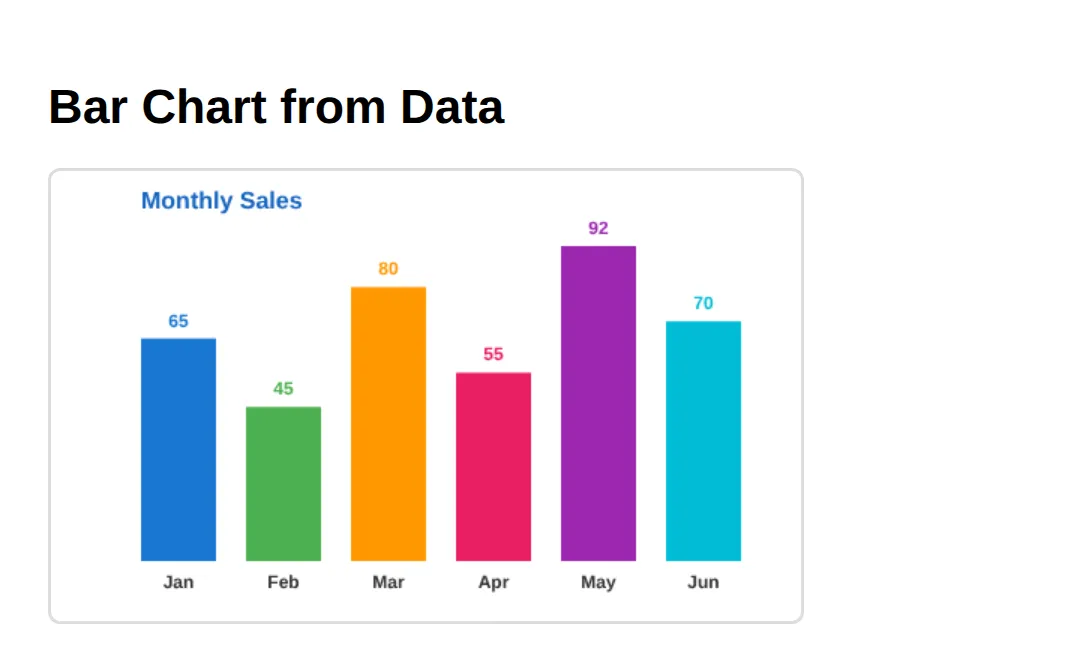
8. 🎯 Mini-challenge — smiley face
No blanks this time — just a comment outline. Combine everything you've learned (paths, arcs, fills, strokes) to draw a smiley face. The trick for the smile: an arc from 0 to Math.PI draws the bottom half of a circle.
<!DOCTYPE html>
<html>
<head><style>
  body { font-family: system-ui, sans-serif; padding: 24px; }
  canvas { border: 2px solid #ddd; border-radius: 8px; background: #fff; display: block; }
</style></head>
<body>
  <h1>🎯 MINI-CHALLENGE — Smiley Face</h1>
  <canvas id="face" width="240" height="240">Canvas not supported.</canvas>
  <script>
    const ctx = document.getElementById('face').getContext('2d');

    // 🎯 MINI-CHALLENGE: draw a smiley face from scratch.
    // 1. Head: a yellow filled circle, centre (120,120), radius 90.
    //    (beginPath → arc → fillStyle 'gold' → fill, then stroke for an outline)
    // 2. Eyes: two small black filled circles near (90,95) and (150,95).
    //    Remember beginPath() before EACH circle.
    // 3. Smile: an arc for the mouth — arc(120, 130, 50, 0, Math.PI) then stroke().
    //    (0 to Math.PI draws the BOTTOM half = a smile)
    //
    // ✅ Expected: a yellow face with two eyes and a curved smile.

    // your code here
  </script>
  <!-- ✅ Expected result, measured in a real browser:
     body -> padding-top: 24px
     canvas -> display: block
  -->
</body>
</html>
When to reach for canvas
- Games: sprite rendering, collision detection, particle effects
- Data visualisation: custom charts, graphs, and infographics
- Image manipulation: filters, cropping, drawing on photos with drawImage
- Signatures: capturing handwritten input on forms
- NOT for: simple icons, logos, or text — use SVG or HTML instead
Common Errors & Fixes
- TypeError: Cannot read properties of null (reading 'getContext') — your getElementById returned null. The <script> ran before the canvas existed, or the id is misspelled. Put the script after the canvas (or in a load handler) and check the id.
- Everything joins into one strange blob — you forgot beginPath(). The path accumulates until you start a new one; call ctx.beginPath() before each shape.
- Shape appears but has no colour — you set fillStyle but never called fill() (or set strokeStyle but never stroke()). Defining a path doesn't paint it.
- Drawing looks blurry / stretched — you sized the canvas with CSS instead of the width/height attributes. Set the resolution with attributes.
- Animation flickers or smears — you didn't clear the previous frame. Call ctx.clearRect(0, 0, w, h) at the top of each frame (or a semi-transparent fillRect for trails).
📋 Quick Reference
| Method / Property | What it does |
|---|---|
| canvas.getContext('2d') | Get the 2D drawing context (the "pen") |
| fillStyle / strokeStyle | Colour for fills / for outlines |
| fillRect(x,y,w,h) | Draw a filled rectangle |
| strokeRect(x,y,w,h) | Draw a rectangle outline |
| clearRect(x,y,w,h) | Erase a rectangular area to transparent |
| beginPath() | Start a new path (call before each shape) |
| arc(x,y,r,0,Math.PI*2) | Add a circle (or arc) to the path |
| moveTo(x,y) / lineTo(x,y) | Move pen without drawing / draw a line |
| fill() / stroke() | Paint the current path's inside / outline |
| fillText(text,x,y) | Draw text (y is the baseline) |
| createLinearGradient(...) | Make a gradient for fillStyle/strokeStyle |
| drawImage(img,x,y) | Draw a loaded image onto the canvas |
| requestAnimationFrame(fn) | Run fn before the next repaint (~60fps) |
🎉 Lesson Complete
- ✅ getContext('2d') hands you the canvas drawing API
- ✅ fillRect, arc, and moveTo/lineTo draw the basic shapes
- ✅ Fill paints the inside; stroke paints the outline
- ✅ createLinearGradient blends colours; fillText renders text
- ✅ Mouse events + lineTo/stroke enable freehand drawing
- ✅ clearRect + requestAnimationFrame produce smooth animation
- ✅ Canvas is pixel-based; SVG is vector-based — choose by use case
- ✅ Size with HTML attributes (not CSS) and add fallback text for accessibility
Practice quiz
How do you get the 2D drawing context from a canvas element?
- canvas.getContext('2d')
- canvas.draw2d()
- canvas.context('2d')
- canvas.get2D()
Answer: canvas.getContext('2d'). canvas.getContext('2d') returns the 2D drawing context — your 'pen' for all drawing methods.
Where is the origin point (0, 0) on a canvas?
- The center
- The bottom-left
- The top-left
- The top-right
Answer: The top-left. Canvas coordinates start at (0,0) in the top-left; x grows right and y grows downward.
What is the correct way to set a canvas's drawing resolution?
- With CSS width and height
- With the width and height HTML attributes
- With the resolution attribute
- It is set automatically
Answer: With the width and height HTML attributes. Set size with the width/height HTML attributes; CSS only stretches the bitmap and causes blur.
What does fillRect(x, y, w, h) do?
- Draws a rectangle outline only
- Draws a filled rectangle
- Clears a rectangle
- Defines a path
Answer: Draws a filled rectangle. fillRect paints a filled rectangle using fillStyle; strokeRect draws only the outline.
Why should you call ctx.beginPath() before drawing a new shape with a path?
- To clear the canvas
- To set the fill color
- So the new shape isn't joined to the previous path
- To start the animation loop
Answer: So the new shape isn't joined to the previous path. Without beginPath() the path keeps accumulating, so every new arc/line joins the previous shape.
What is the difference between fill() and stroke()?
- fill() paints the inside, stroke() paints the outline
- fill() paints the outline, stroke() paints the inside
- They are identical
- Only fill() works on paths
Answer: fill() paints the inside, stroke() paints the outline. fill() paints the inside of a path using fillStyle; stroke() paints its outline using strokeStyle.
Which method draws a full circle as a path?
- circle(x, y, r)
- arc(x, y, r, 0, Math.PI * 2)
- ellipse(x, y, r)
- drawCircle(x, y, r)
Answer: arc(x, y, r, 0, Math.PI * 2). arc(x, y, radius, 0, Math.PI * 2) sweeps a full 360-degree circle.
Which method should you call each frame to schedule smooth ~60fps animation?
- setInterval(fn, 16)
- requestAnimationFrame(fn)
- setTimeout(fn, 60)
- ctx.animate(fn)
Answer: requestAnimationFrame(fn). requestAnimationFrame(fn) runs fn right before the next repaint, about 60 times per second.
How do you erase a rectangular area of the canvas back to transparent?
- ctx.eraseRect(...)
- ctx.clearRect(x, y, w, h)
- ctx.deleteRect(...)
- ctx.reset()
Answer: ctx.clearRect(x, y, w, h). clearRect(x, y, w, h) erases that rectangle to transparent — used to clear each animation frame.
Compared to canvas, what is SVG better suited for?
- Per-pixel image filters
- Games with many sprites
- Crisp icons and logos that scale
- Real-time particle effects
Answer: Crisp icons and logos that scale. SVG is vector-based, staying sharp at any zoom — ideal for icons, logos, and diagrams.
Continue this course
- Previous: Building Reusable UI Components in Pure CSS
- Next: SVG Mastery: Paths, Gradients, Filters, Animation — Write and animate SVG inline for scalable, interactive graphics
- Quick reference: HTML & CSS cheat sheet
Frequently asked questions
What is the HTML <canvas> element used for?
Canvas is a pixel-based drawing surface you control with JavaScript. It is ideal for games, data visualisations, image editing, charts, signature pads, and real-time effects. For static icons, logos, and diagrams, SVG is usually a better fit because it scales without blurring and its parts are real DOM elements.
Why is my canvas drawing blurry or stretched?
You almost certainly set the size with CSS instead of the HTML width and height attributes. CSS only stretches the existing bitmap, so the resolution stays low and the pixels smear. Always size the canvas with attributes like <canvas width="500" height="300">, and only use CSS if you genuinely want to stretch the result.
What is the difference between fill and stroke?
Fill paints the inside of a shape using fillStyle, while stroke paints only its outline using strokeStyle and lineWidth. fillRect and strokeRect are shortcuts for rectangles; for paths you call ctx.fill() and/or ctx.stroke() after defining the path. You can do both on the same shape to get an outlined, filled shape.
Why do all my shapes connect into one weird blob?
You forgot beginPath(). The canvas keeps adding to the current path until you start a new one, so every arc and lineTo joins the previous shape. Call ctx.beginPath() before each new shape and the problem disappears.
How do animations work on canvas?
Use requestAnimationFrame(callback). The browser calls your function about 60 times per second, right before each repaint. Inside it you clear the canvas (or paint a semi-transparent layer for trails), redraw everything at its new position, then call requestAnimationFrame again to schedule the next frame.
Is canvas accessible to screen readers?
Not by default — canvas pixels are invisible to assistive tech. Put meaningful fallback text between the <canvas> tags, add an aria-label or role, and where possible provide the same information in plain HTML nearby. For purely decorative drawings, mark them so screen readers can skip them.